Plot several distributions
Arguments
- ...
distribution objects (must be named)
- distributions
Named list of distribution objects. This is concatenated with
....- .x
Numeric vector of points to evaluate at.
- plots
Plots to be created. May be abbreviated. The plots will be stacked in the order given from top to bottom.
- with_params
list of distribution parameters to be given to each distribution using
with_params. If named, the names are matched to the distribution names. Otherwise, they are allocated positionally, index 1 corresponding to the first element ofdistributions, then all other elements fromdistributionsfollowed by the arguments in...in order.- as_list
return a list of ggplots instead of a patchwork?
Examples
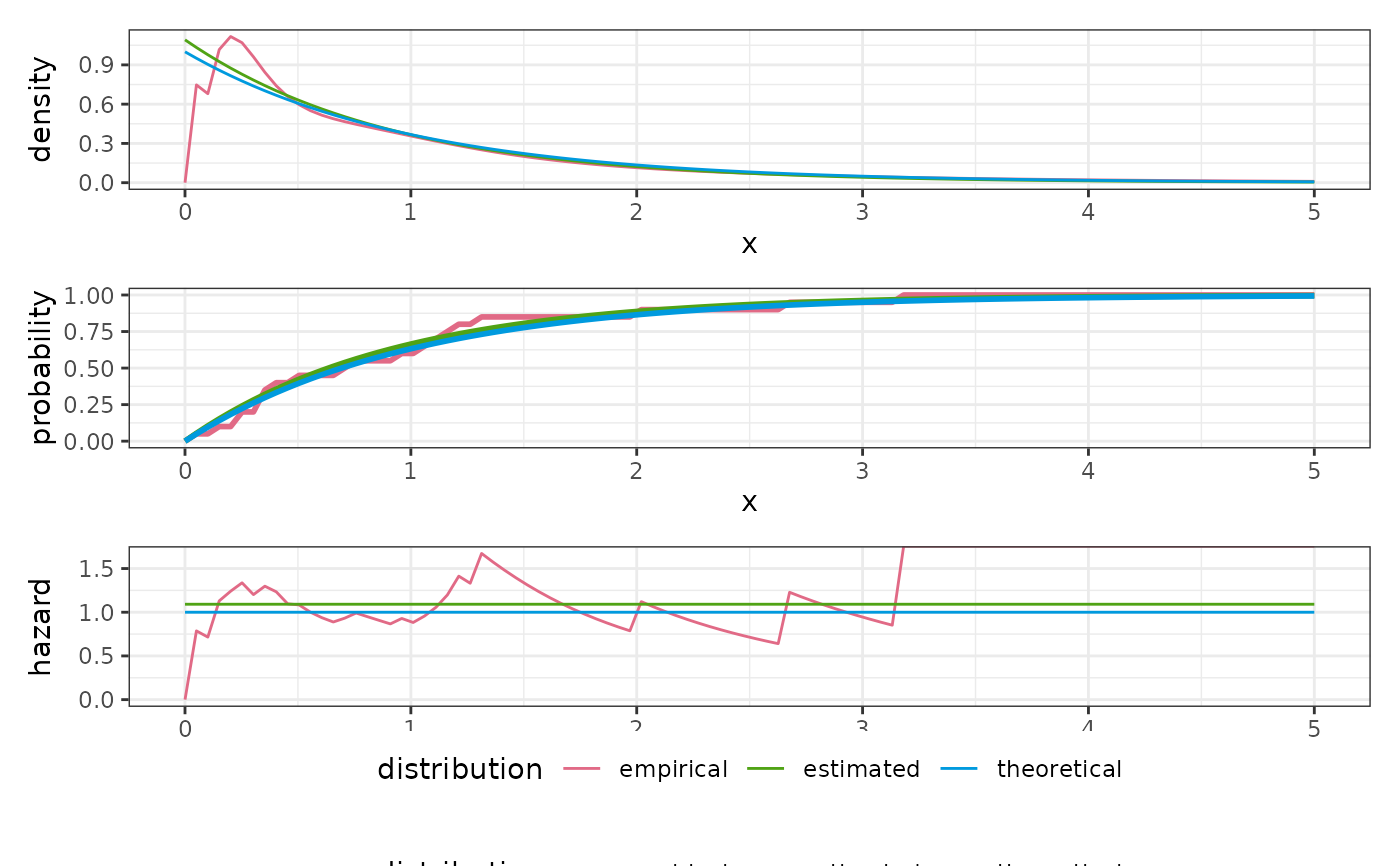
rate <- 1
x <- rexp(20, rate)
d_emp <- dist_empirical(x, positive = TRUE)
d_exp <- dist_exponential()
plot_distributions(
  empirical = d_emp,
  theoretical = d_exp,
  estimated = d_exp,
  with_params = list(
    theoretical = list(rate = rate),
    estimated = list(rate = 1 / mean(x))
  ),
  .x = seq(1e-4, 5, length.out = 100)
)