Flatten / Inflate parameter lists / vectors
Usage
flatten_params(params)

flatten_params_matrix(params)

flatten_bounds(bounds)

inflate_params(flat_params)
Arguments
- params
A named list of parameters to be flattened. Should be in a form to be passed as the
with_paramsargument to most distribution functions.- bounds
List of parameter bounds as returned by
dist$get_param_bounds()- flat_params
A named numeric vector of parameters
Value
flatten_params returns a 'flattened' vector of parameters.
It is intended as an adapter for multi-dimensional optimisation functions
to distribution objects.
flatten_params_matrix returns a 'flattened' matrix of parameters.
It is intended as an adapter for multi-dimensional optimisation functions
to distribution objects. Each column corresponds to one input element.
flatten_bounds returns a named list of vectors with names lower
and upper. Containing the upper and lower bounds of each parameter.
inflate_params returns an 'inflated' list of parameters.
This can be passed as the with_params argument to most distribution
functions.
Examples
library(ggplot2)

mm <- dist_mixture(list(
  dist_exponential(NULL),
  dist_lognormal(0.5, NULL)
), list(NULL, 1))

ph <- mm$get_placeholders()
ph_flat <- flatten_params(ph)
ph_reinflated <- inflate_params(ph_flat)
ph_flat[] <- c(1, 1, 6)
ph_sample <- inflate_params(ph_flat)

x <- mm$sample(
  100,
  with_params = ph_sample
)

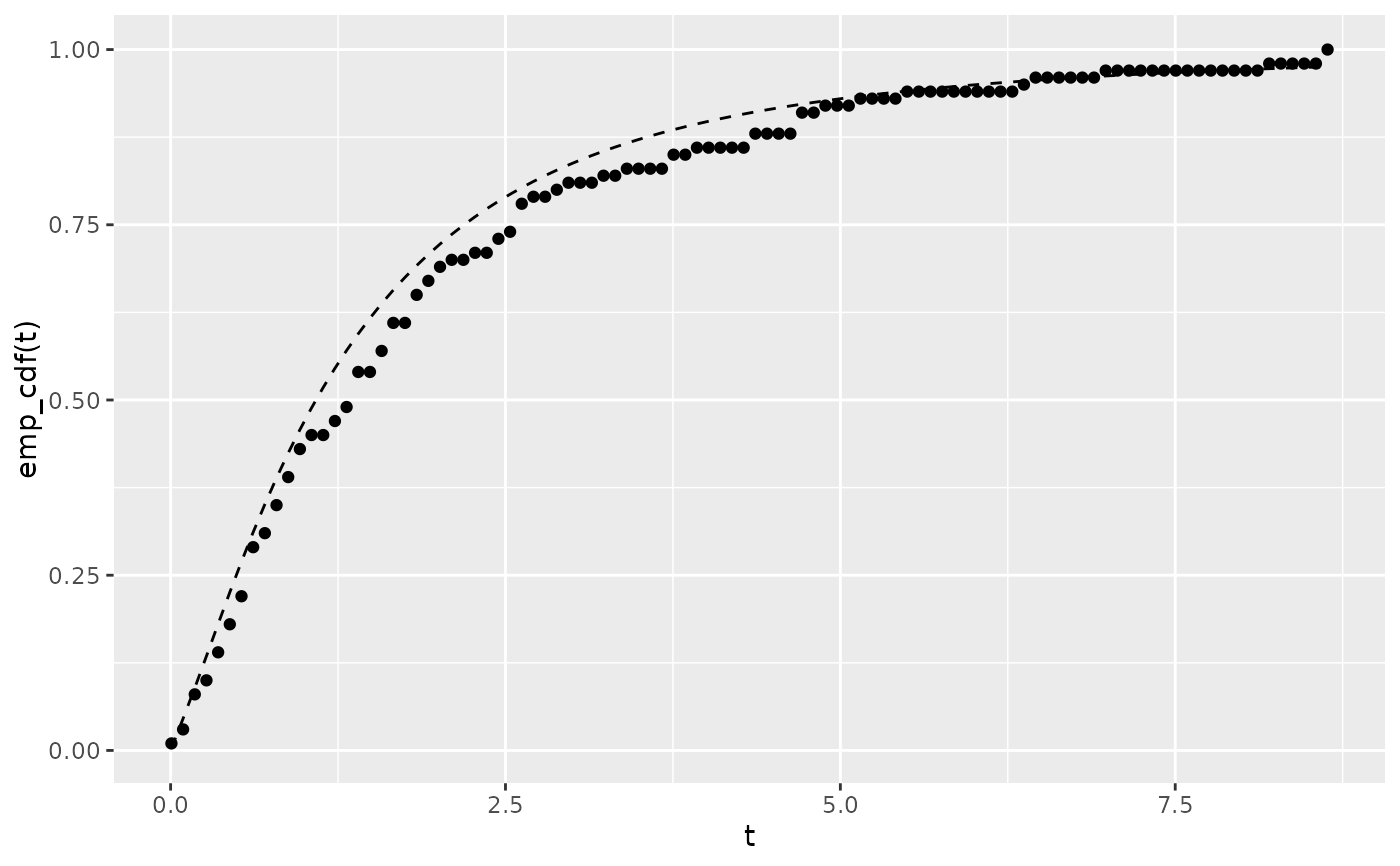
emp_cdf <- ecdf(x)

ggplot(data.frame(t = seq(from = min(x), to = max(x), length.out = 100))) %+%
  geom_point(aes(x = t, y = emp_cdf(t))) %+%
  geom_line(aes(x = t, y = mm$probability(t, with_params = ph_sample)),
            linetype = 2)
