Transition functions for blended distributions
Usage
blended_transition(x, u, eps, .gradient = FALSE, .extend_na = FALSE)

blended_transition_inv(x, u, eps, .component)
Arguments
- x
Points to evaluate at
- u
Sorted vector of blending thresholds, or rowwise sorted matrix of blending thresholds
- eps
Corresponding vector or matrix of blending bandwidths. Must be positive and the same dimensions as
u, or scalar. No rowwise blending regions (u - eps, u + eps) may overlap.- .gradient
Also evaluate the gradient with respect to
x?- .extend_na
Extend out-of range transitions by the last in-range value (i.e. the corresponding u) or by NA?
- .component
Component index (up to
length(u) + 1) to invert.
Value
blended_transition returns a matrix with length(x) rows and length(u) + 1 columns containing the
transformed values for each of the blending components.
If .gradient is TRUE, an attribute "gradient" is attached with the same dimensions, containing the derivative
of the respective transition component with respect to x.
blended_transition_inv returns a vector with length(x) values containing the inverse of the transformed
values for the .componentth blending component.
Examples
library(ggplot2)
xx <- seq(from = 0, to = 20, length.out = 101)
blend_mat <- blended_transition(xx, u = 10, eps = 3, .gradient = TRUE)
ggplot(
data.frame(
x = rep(xx, 2L),
fun = rep(c("p", "q"), each = length(xx)),
y = as.numeric(blend_mat),
relevant = c(xx <= 13, xx >= 7)
),
aes(x = x, y = y, color = fun, linetype = relevant)
) %+%
geom_line() %+%
theme_bw() %+%
theme(
legend.position = "bottom", legend.box = "horizontal"
) %+%
guides(color = guide_legend(direction = "horizontal", title = ""), linetype = guide_none()) %+%
scale_linetype_manual(values = c("TRUE" = 1, "FALSE" = 3))
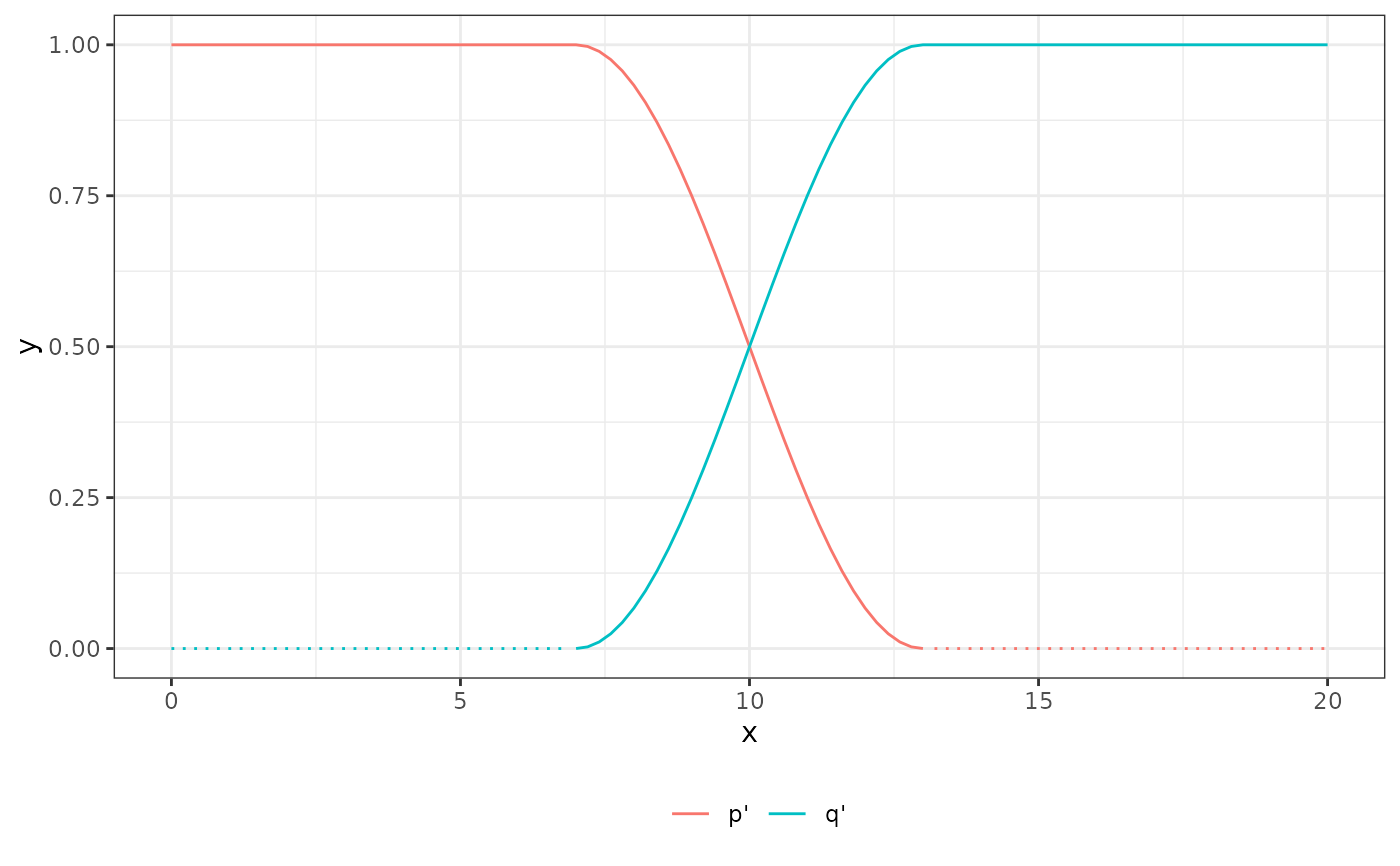
 ggplot(
data.frame(
x = rep(xx, 2L),
fun = rep(c("p'", "q'"), each = length(xx)),
y = as.numeric(attr(blend_mat, "gradient")),
relevant = c(xx <= 13, xx >= 7)
),
aes(x = x, y = y, color = fun, linetype = relevant)
) %+%
geom_line() %+%
theme_bw() %+%
theme(
legend.position = "bottom", legend.box = "horizontal"
) %+%
guides(color = guide_legend(direction = "horizontal", title = ""), linetype = guide_none()) %+%
scale_linetype_manual(values = c("TRUE" = 1, "FALSE" = 3))
ggplot(
data.frame(
x = rep(xx, 2L),
fun = rep(c("p'", "q'"), each = length(xx)),
y = as.numeric(attr(blend_mat, "gradient")),
relevant = c(xx <= 13, xx >= 7)
),
aes(x = x, y = y, color = fun, linetype = relevant)
) %+%
geom_line() %+%
theme_bw() %+%
theme(
legend.position = "bottom", legend.box = "horizontal"
) %+%
guides(color = guide_legend(direction = "horizontal", title = ""), linetype = guide_none()) %+%
scale_linetype_manual(values = c("TRUE" = 1, "FALSE" = 3))