These functions provide information about the generalized Pareto distribution
with threshold u. dgpd gives the density, pgpd gives the distribution
function, qgpd gives the quantile function and rgpd generates random
deviates.
Usage
rgpd(n = 1L, u = 0, sigmau = 1, xi = 0)

dgpd(x, u = 0, sigmau = 1, xi = 0, log = FALSE)

pgpd(q, u = 0, sigmau = 1, xi = 0, lower.tail = TRUE, log.p = FALSE)

qgpd(p, u = 0, sigmau = 1, xi = 0, lower.tail = TRUE, log.p = FALSE)
Arguments
- n
integer number of observations.
- u
threshold parameter (minimum value).
- sigmau
scale parameter (must be positive).
- xi
shape parameter
- x, q
vector of quantiles.
- log, log.p
logical; if
TRUE, probabilities/densitiespare given aslog(p).- lower.tail
logical; if
TRUE(default), probabilities are \(P(X \le x)\), otherwise \(P(X > x)\).- p
vector of probabilities.
Value
rgpd generates random deviates.
dgpd gives the density.
pgpd gives the distribution function.
qgpd gives the quantile function.
Details
If u, sigmau or xi are not specified, they assume the default values of
0, 1 and 0 respectively.
The generalized Pareto distribution has density
$$f(x) = 1 / \sigma_u (1 + \xi z)^(- 1 / \xi - 1)$$
where \(z = (x - u) / \sigma_u\) and \(f(x) = exp(-z)\) if \(\xi\) is 0. The support is \(x \ge u\) for \(\xi \ge 0\) and \(u \le x \le u - \sigma_u / \xi\) for \(\xi < 0\).
The Expected value exists if \(\xi < 1\) and is equal to
$$E(X) = u + \sigma_u / (1 - \xi)$$
k-th moments exist in general for \(k\xi < 1\).
Examples
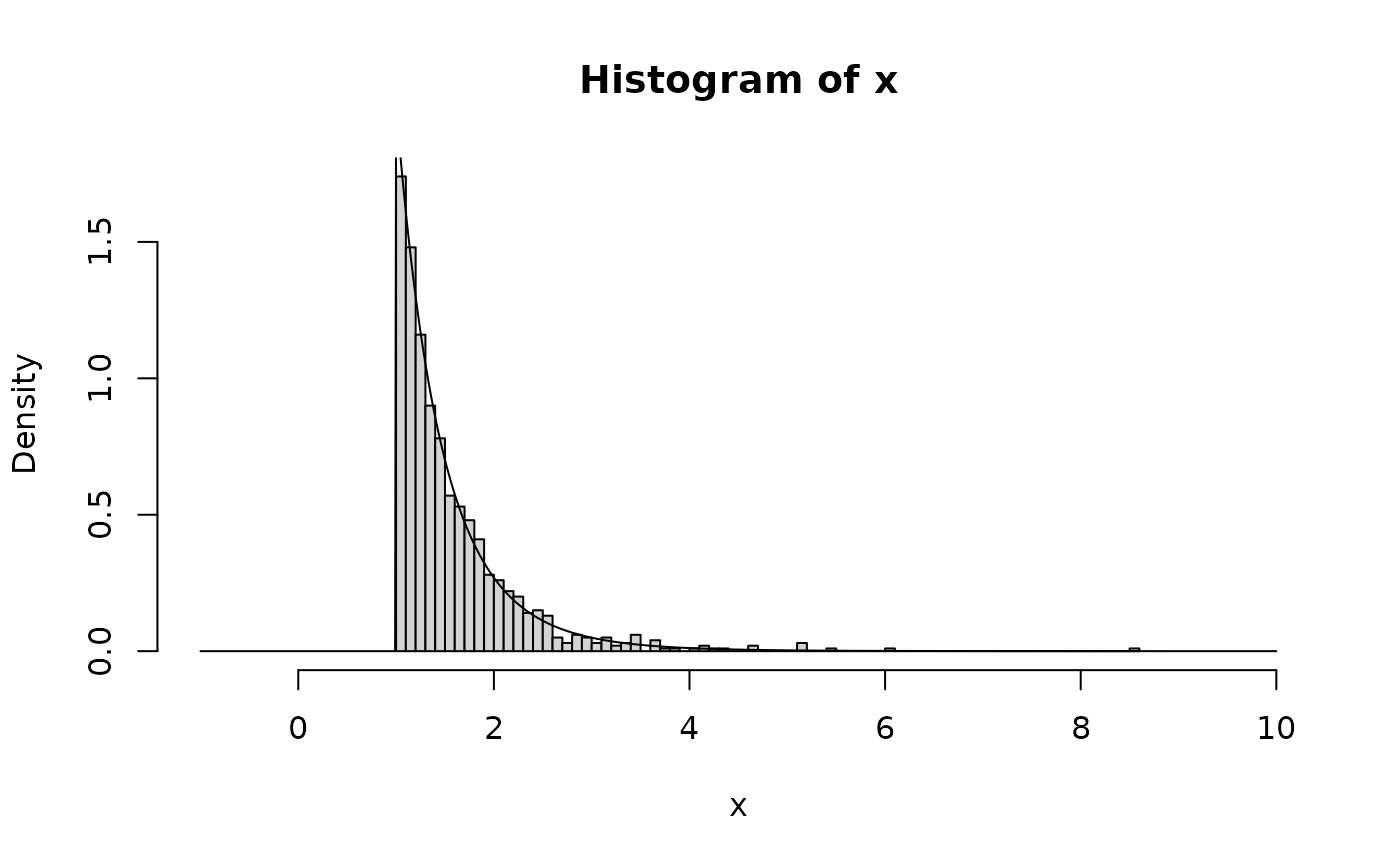
x <- rgpd(1000, u = 1, sigmau = 0.5, xi = 0.1)
xx <- seq(-1, 10, 0.01)
hist(x, breaks = 100, freq = FALSE, xlim = c(-1, 10))
lines(xx, dgpd(xx, u = 1, sigmau = 0.5, xi = 0.1))
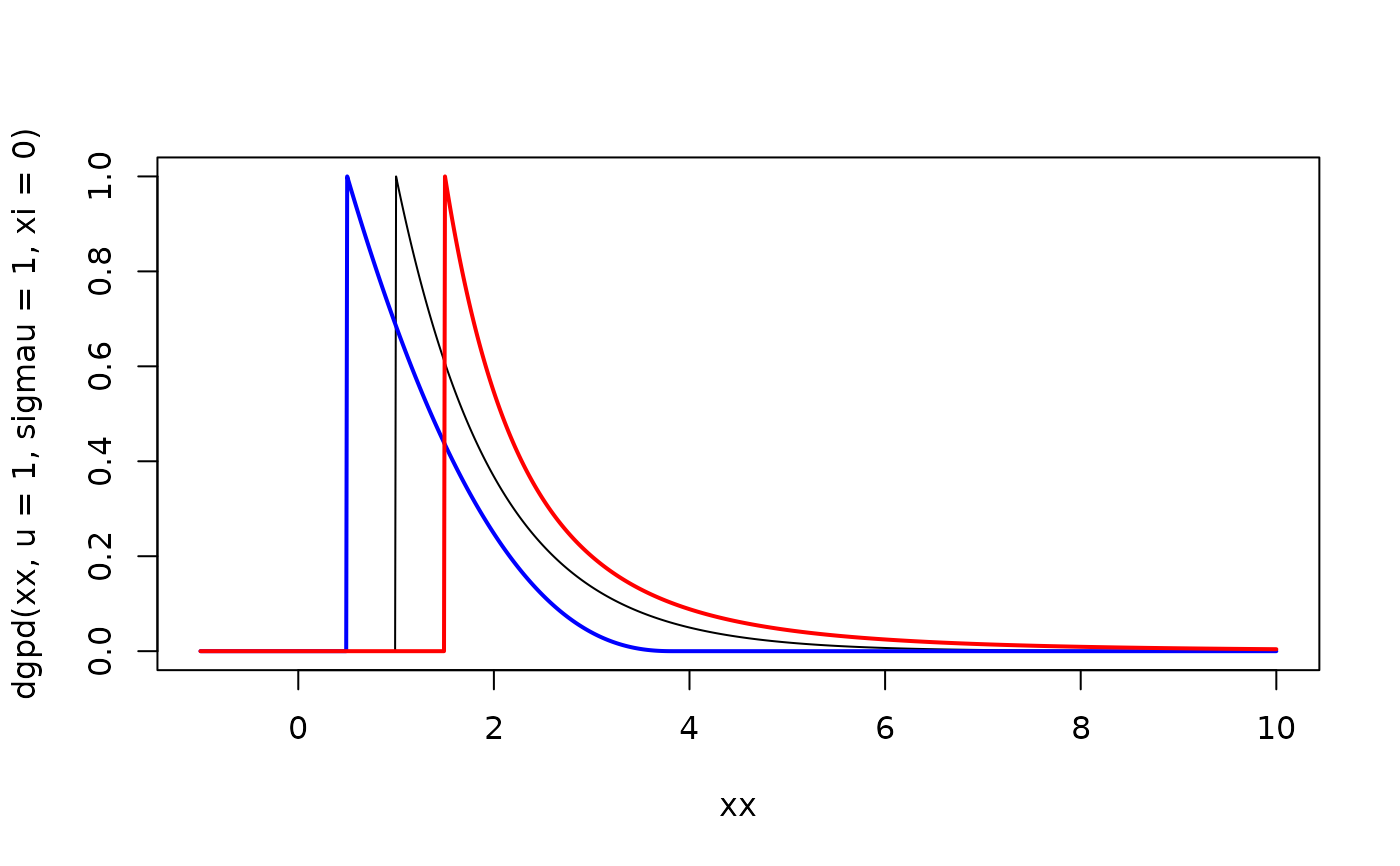
 plot(xx, dgpd(xx, u = 1, sigmau = 1, xi = 0), type = "l")
lines(xx, dgpd(xx, u = 0.5, sigmau = 1, xi = -0.3), col = "blue", lwd = 2)
lines(xx, dgpd(xx, u = 1.5, sigmau = 1, xi = 0.3), col = "red", lwd = 2)
plot(xx, dgpd(xx, u = 1, sigmau = 1, xi = 0), type = "l")
lines(xx, dgpd(xx, u = 0.5, sigmau = 1, xi = -0.3), col = "blue", lwd = 2)
lines(xx, dgpd(xx, u = 1.5, sigmau = 1, xi = 0.3), col = "red", lwd = 2)
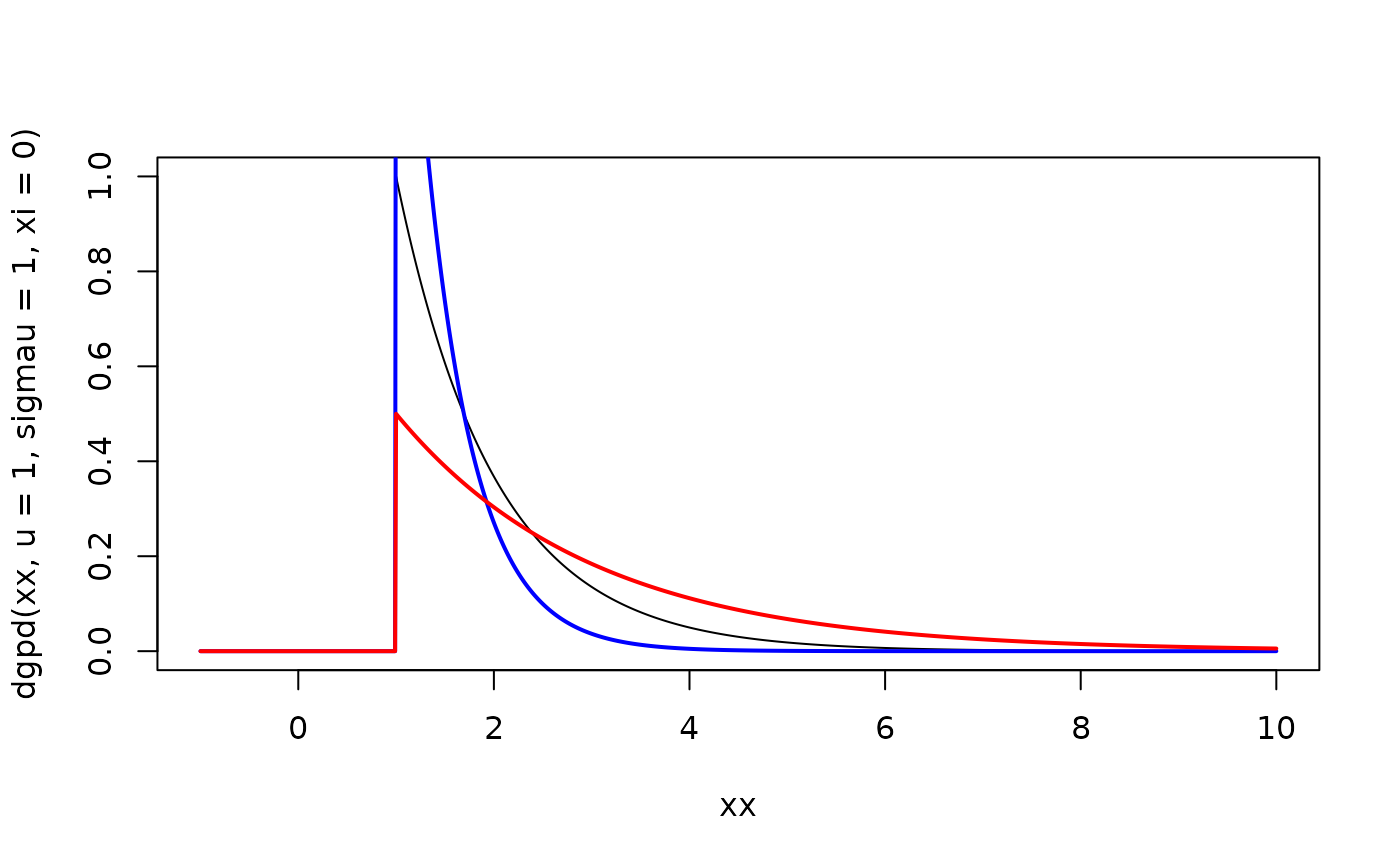
 plot(xx, dgpd(xx, u = 1, sigmau = 1, xi = 0), type = "l")
lines(xx, dgpd(xx, u = 1, sigmau = 0.5, xi = 0), col = "blue", lwd = 2)
lines(xx, dgpd(xx, u = 1, sigmau = 2, xi = 0), col = "red", lwd = 2)
plot(xx, dgpd(xx, u = 1, sigmau = 1, xi = 0), type = "l")
lines(xx, dgpd(xx, u = 1, sigmau = 0.5, xi = 0), col = "blue", lwd = 2)
lines(xx, dgpd(xx, u = 1, sigmau = 2, xi = 0), col = "red", lwd = 2)